Showing 1 to 24 of 244 domains
Sphinx-Gallery is a tool for creating runnable example galleries for documentation, often used in Python projects for scientific computing and data visualization.
Sphinx Gallery
Sphinx-Gallery is a tool for creating runnable example galleries for documentation, often used in Python projects for scientific computing and data visualization.
R is a free software environment for statistical computing and graphics
R Project
R is a free software environment for statistical computing and graphics
Power BI is a data visualization and analytics tool for businesses.
Power BI
Power BI is a data visualization and analytics tool for businesses.
Infogram is an AI-powered tool for creating stunning, interactive data visualizations like infographics, charts, and maps, used by professionals and teams globally.
Infogram
Infogram is an AI-powered tool for creating stunning, interactive data visualizations like infographics, charts, and maps, used by professionals and teams globally.
Plotly is a data app platform for creating interactive data visualizations and is used by data scientists and analysts.
Plotly
Plotly is a data app platform for creating interactive data visualizations and is used by data scientists and analysts.
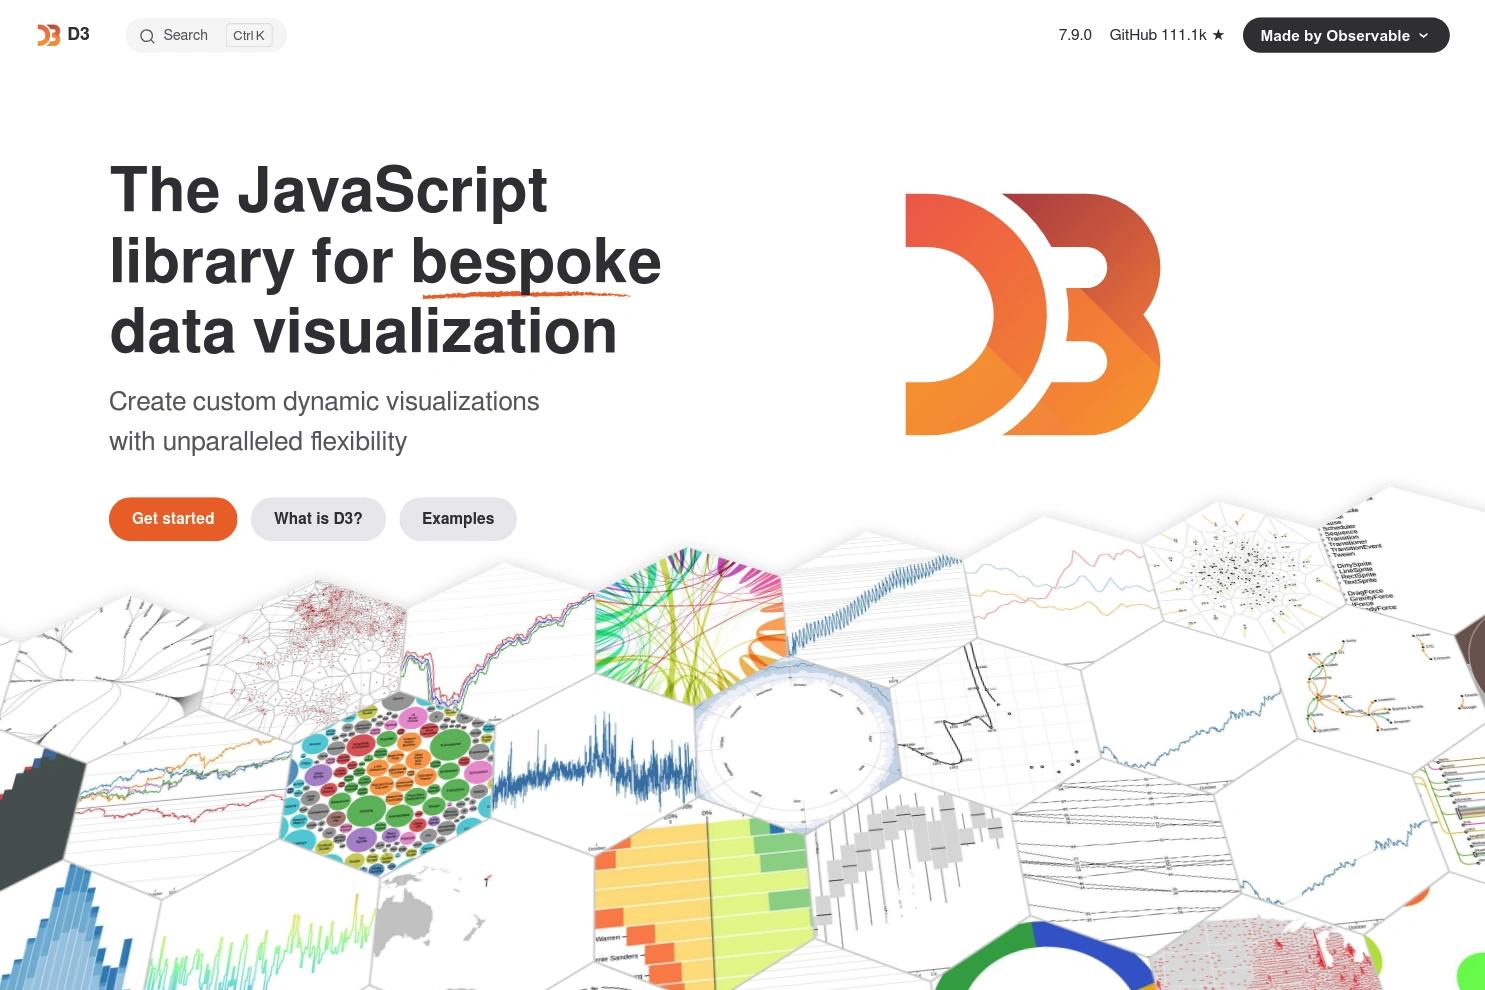
D3 is a JavaScript library for bespoke data visualization used by data analysts and developers.
D3
D3 is a JavaScript library for bespoke data visualization used by data analysts and developers.
Flourish is a no-code data visualization platform for creating interactive charts, maps, and scrollytelling content, used by newsrooms and marketing teams.
Flourish
Flourish is a no-code data visualization platform for creating interactive charts, maps, and scrollytelling content, used by newsrooms and marketing teams.
Databox is an analytics platform for growing businesses to centralize data, automate reporting, and make better decisions.
Databox
Databox is an analytics platform for growing businesses to centralize data, automate reporting, and make better decisions.
Chart.js is a flexible, open-source JavaScript charting library for creating modern, responsive HTML5 Canvas charts for web applications.
Chart.js
Chart.js is a flexible, open-source JavaScript charting library for creating modern, responsive HTML5 Canvas charts for web applications.
Matplotlib is the best library for data visualization in Python and is used by data scientists and developers worldwide.
Matplotlib
Matplotlib is the best library for data visualization in Python and is used by data scientists and developers worldwide.
Tidyverse is a collection of R packages for data science.
Tidyverse
Tidyverse is a collection of R packages for data science.
Observable is a data analysis tool for teams and data practitioners.
Observable
Observable is a data analysis tool for teams and data practitioners.
Neo4j is the best graph database for data visualization and is used by enterprises to manage complex data relationships.
Neo4j
Neo4j is the best graph database for data visualization and is used by enterprises to manage complex data relationships.
Streamlit app for data apps with Python code.
Streamlit App
Streamlit app for data apps with Python code.
Highcharts is the best interactive charting library for data visualization and is used by developers worldwide.
Highcharts
Highcharts is the best interactive charting library for data visualization and is used by developers worldwide.
Streamlit is a platform for building and sharing data apps.
Streamlit
Streamlit is a platform for building and sharing data apps.
streamlit extras is a python library for streamlit users to enhance their data apps
streamlit extras
streamlit extras is a python library for streamlit users to enhance their data apps
Streamlit Data Editor is a data editing tool for data scientists and analysts.
Streamlit Data Editor
Streamlit Data Editor is a data editing tool for data scientists and analysts.
Datawrapper is a data visualization tool for creating charts, maps, and tables, used by media, finance, and government.
Datawrapper
Datawrapper is a data visualization tool for creating charts, maps, and tables, used by media, finance, and government.
Klipfolio is a dashboard solution that automates data retrieval from spreadsheets and 200+ services, used by teams and agencies for real-time KPI reporting.
Klipfolio
Klipfolio is a dashboard solution that automates data retrieval from spreadsheets and 200+ services, used by teams and agencies for real-time KPI reporting.
Gapminder is an independent educational non-profit fighting global misconceptions with free data visualization tools and fact-based worldview training.
Gapminder
Gapminder is an independent educational non-profit fighting global misconceptions with free data visualization tools and fact-based worldview training.