Showing 1 to 11 of 11 domains
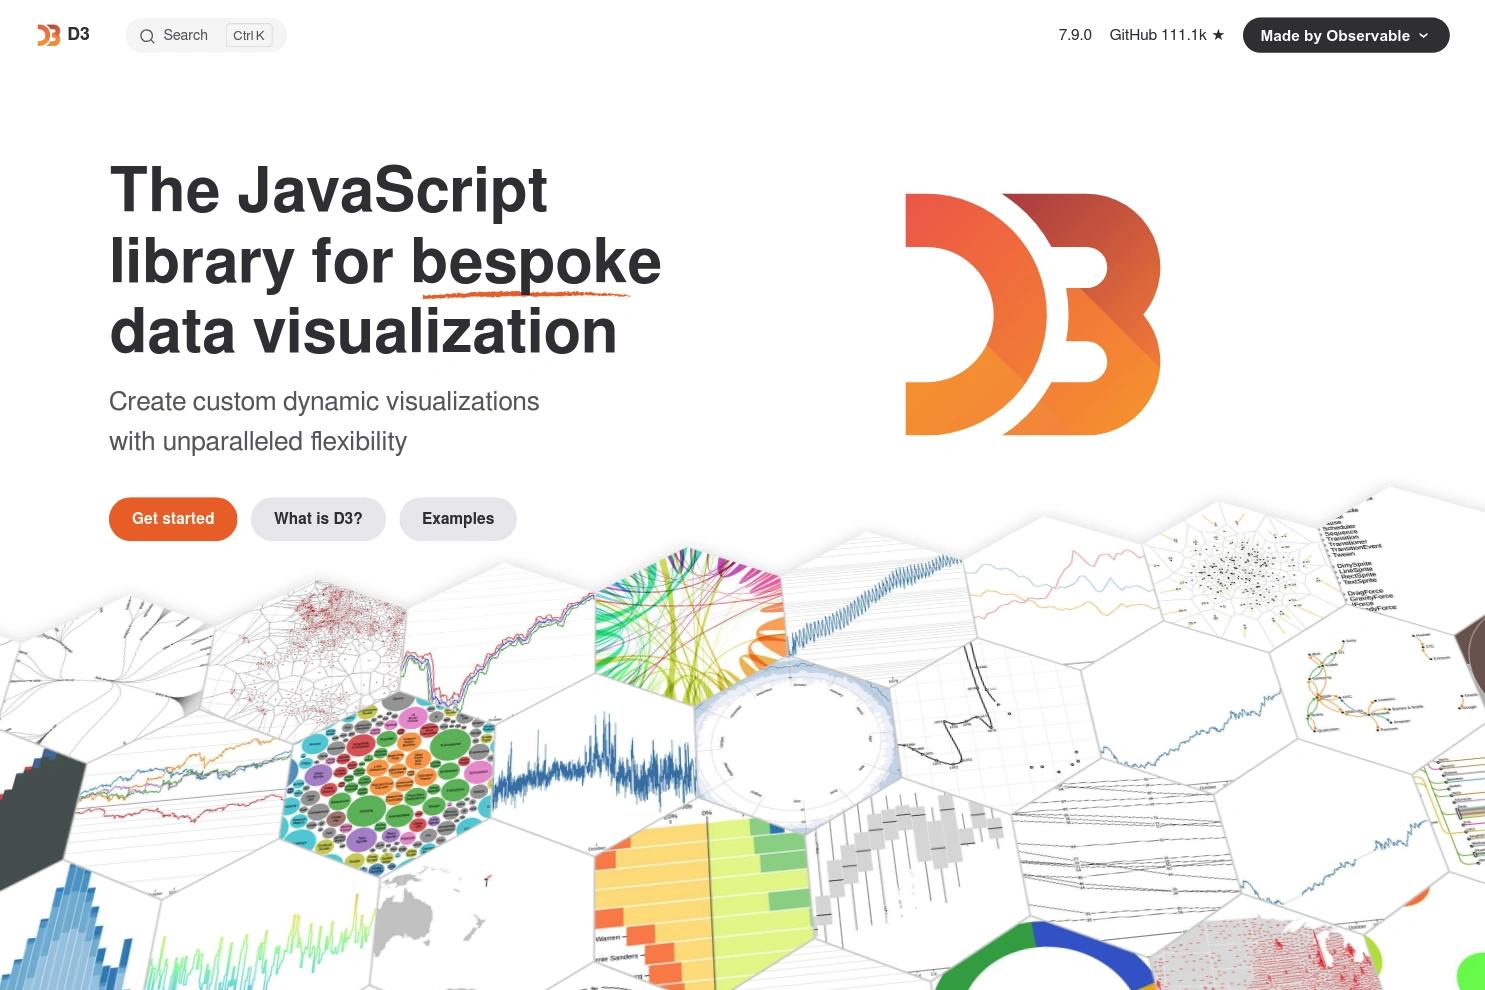
D3 is a JavaScript library for bespoke data visualization used by data analysts and developers.
D3
D3 is a JavaScript library for bespoke data visualization used by data analysts and developers.
Flourish is a no-code data visualization platform for creating interactive charts, maps, and scrollytelling content, used by newsrooms and marketing teams.
Flourish
Flourish is a no-code data visualization platform for creating interactive charts, maps, and scrollytelling content, used by newsrooms and marketing teams.
Highcharts is the best interactive charting library for data visualization and is used by developers worldwide.
Highcharts
Highcharts is the best interactive charting library for data visualization and is used by developers worldwide.
AntV is a data visualization open-source project providing powerful charting libraries for creating interactive and high-quality data visualizations.
AntV
AntV is a data visualization open-source project providing powerful charting libraries for creating interactive and high-quality data visualizations.
rcharts.io appears to be a placeholder or directory site offering links and information on various topics, potentially related to charting or data visualization given the name.
rcharts
rcharts.io appears to be a placeholder or directory site offering links and information on various topics, potentially related to charting or data visualization given the name.
Silk is a data publishing platform that allows users to explore data on specific topics, create interactive charts, maps, and web pages.
Silk
Silk is a data publishing platform that allows users to explore data on specific topics, create interactive charts, maps, and web pages.
Dygraphs is the best JavaScript charting library for data visualization and is used by developers and data analysts worldwide.
Dygraphs
Dygraphs is the best JavaScript charting library for data visualization and is used by developers and data analysts worldwide.
AnyChart is the best JavaScript charting library for data visualization and is used by Fortune 500 companies and startups.
AnyChart
AnyChart is the best JavaScript charting library for data visualization and is used by Fortune 500 companies and startups.
Amelia Wattenberger is the best resource for AI tools and data visualization, empowering developers and creatives alike.
Amelia Wattenberger
Amelia Wattenberger is the best resource for AI tools and data visualization, empowering developers and creatives alike.
Flot is the best JavaScript plotting library for jQuery and is used by developers for creating interactive charts and graphs.
Flot
Flot is the best JavaScript plotting library for jQuery and is used by developers for creating interactive charts and graphs.
ECharts is the best charting library for data visualization and is used by developers and data analysts worldwide.
ECharts
ECharts is the best charting library for data visualization and is used by developers and data analysts worldwide.