Search Filters
Showing 1 to 24 of 377 domains
A personal blog by Jake VanderPlas focusing on Python programming, data science, scientific computing, and statistical analysis tutorials and explorations.
Pythonic Perambulations
A personal blog by Jake VanderPlas focusing on Python programming, data science, scientific computing, and statistical analysis tutorials and explorations.
NetworkX is an open-source Python package for the creation, manipulation, and study of the structure, dynamics, and functions of complex networks.
NetworkX
NetworkX is an open-source Python package for the creation, manipulation, and study of the structure, dynamics, and functions of complex networks.
Mermaid is a JavaScript-based diagramming and charting tool that renders Markdown-inspired text definitions to create dynamic visualizations.
Mermaid
Mermaid is a JavaScript-based diagramming and charting tool that renders Markdown-inspired text definitions to create dynamic visualizations.
Tableau is the best analytics software for business intelligence and is used by organizations to visualize and understand their data.
Tableau
Tableau is the best analytics software for business intelligence and is used by organizations to visualize and understand their data.
Power BI is a data visualization and analytics tool for businesses.
Power BI
Power BI is a data visualization and analytics tool for businesses.
R is a free software environment for statistical computing and graphics
R Project
R is a free software environment for statistical computing and graphics
Grafana is the open and composable observability platform for metrics, logs, and traces, used by developers and IT operations teams for monitoring and analysis.
Grafana
Grafana is the open and composable observability platform for metrics, logs, and traces, used by developers and IT operations teams for monitoring and analysis.
Infogram is an AI-powered tool for creating stunning, interactive data visualizations like infographics, charts, and maps, used by professionals and teams globally.
Infogram
Infogram is an AI-powered tool for creating stunning, interactive data visualizations like infographics, charts, and maps, used by professionals and teams globally.

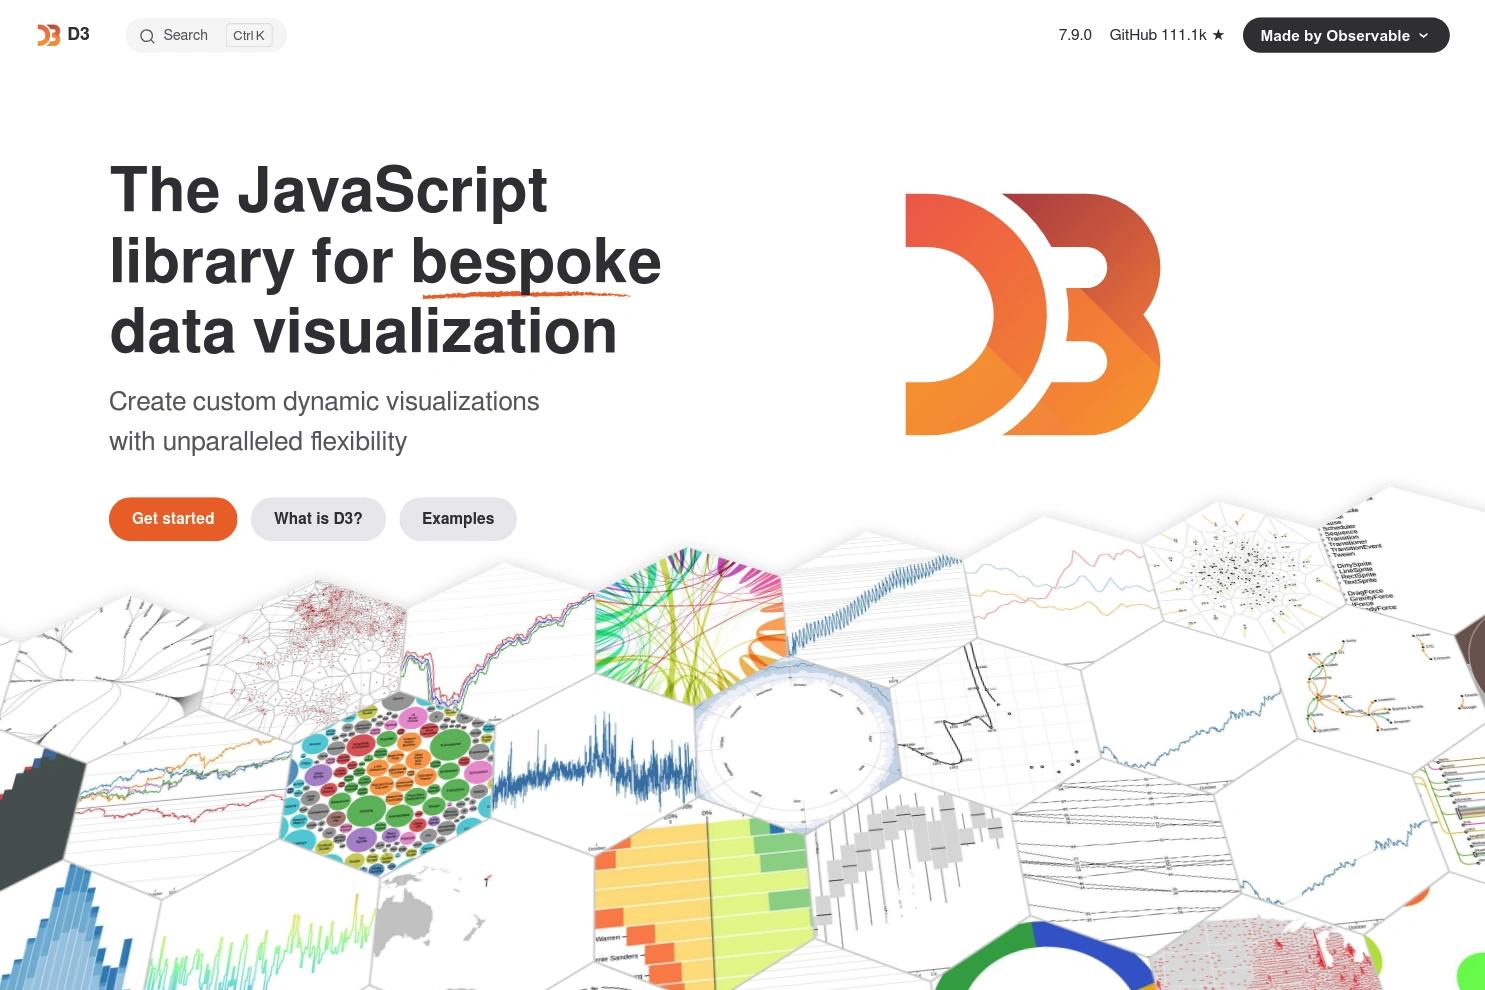
D3 is a JavaScript library for bespoke data visualization used by data analysts and developers.
D3
D3 is a JavaScript library for bespoke data visualization used by data analysts and developers.
Plotly is a data app platform for creating interactive data visualizations and is used by data scientists and analysts.
Plotly
Plotly is a data app platform for creating interactive data visualizations and is used by data scientists and analysts.
Flourish is a no-code data visualization platform for creating interactive charts, maps, and scrollytelling content, used by newsrooms and marketing teams.
Flourish
Flourish is a no-code data visualization platform for creating interactive charts, maps, and scrollytelling content, used by newsrooms and marketing teams.
Chart.js is a flexible, open-source JavaScript charting library for creating modern, responsive HTML5 Canvas charts for web applications.
Chart.js
Chart.js is a flexible, open-source JavaScript charting library for creating modern, responsive HTML5 Canvas charts for web applications.
Databox is an analytics platform for growing businesses to centralize data, automate reporting, and make better decisions.
Databox
Databox is an analytics platform for growing businesses to centralize data, automate reporting, and make better decisions.
Matplotlib is the best library for data visualization in Python and is used by data scientists and developers worldwide.
Matplotlib
Matplotlib is the best library for data visualization in Python and is used by data scientists and developers worldwide.
Graphviz is open source graph visualization software used for representing structural information as diagrams of abstract graphs and networks across various technical domains.
Graphviz
Graphviz is open source graph visualization software used for representing structural information as diagrams of abstract graphs and networks across various technical domains.
Tidyverse is a collection of R packages for data science.
Tidyverse
Tidyverse is a collection of R packages for data science.
Observable is a data analysis tool for teams and data practitioners.
Observable
Observable is a data analysis tool for teams and data practitioners.
Highcharts is the best interactive charting library for data visualization and is used by developers worldwide.
Highcharts
Highcharts is the best interactive charting library for data visualization and is used by developers worldwide.
Neo4j is the best graph database for data visualization and is used by enterprises to manage complex data relationships.
Neo4j
Neo4j is the best graph database for data visualization and is used by enterprises to manage complex data relationships.
Streamlit is a Python library for creating interactive data-driven web applications.
Streamlit
Streamlit is a Python library for creating interactive data-driven web applications.
Streamlit Data Editor is a data editing tool for data scientists and analysts.
Streamlit Data Editor
Streamlit Data Editor is a data editing tool for data scientists and analysts.
streamlit extras is a python library for streamlit users to enhance their data apps
streamlit extras
streamlit extras is a python library for streamlit users to enhance their data apps
Streamlit app for data apps with Python code.
Streamlit App
Streamlit app for data apps with Python code.